The beauty of modern web design can be found in the widespread advancement of visual and dynamic effects. CSS3 took the design world to another level with independent animation properties. But digging even further, you’ll notice that open-source code has revolutionized the process of creating and using such a code library.
There’s no doubt that JavaScript is the king of front-end scripting. It’s a fascinating language to create visual effects without any need for backend programming. This is why JavaScript is a natural choice for creating big data charts, graphs, tables, or dynamic interfaces.
The following resources are perfect for any developer that need to build chart-based data for their website(s). Data libraries are often quite detailed, with lots of extra methods and parameters. But as you practice coding and learn JavaScript, setting up a new data chart will become like second nature.
Chart.js
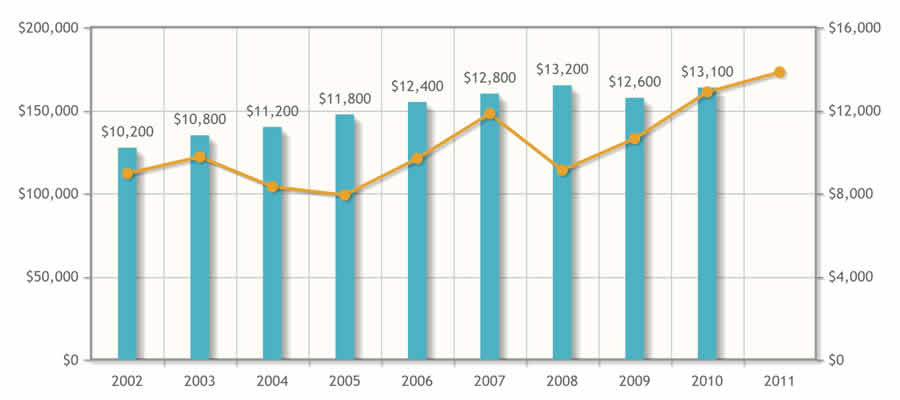
HTML5 is the future of layout rendering and Chart.js is here to usher data charts into that future. Chart.js is perhaps the classic open source library for generating any type of data chart, graph, or visualization element.
Everything is rendered using HTML5 with the added benefit of a canvas element for dynamic effects. Graphs rendered onto an HTML5 canvas allow for hover tooltips and click events to access more information about charted data. The various options range from pie charts, bar charts, radar charts, line charts, and other more advanced styles.

jqPlot
jqPlot renders content as static images which are embedded dynamically. This means chart data can be updated via Ajax without even refreshing the page. Some chart types even have hover options which display related data on hover.
Although there are dozens of various chart styles, the default chart themes are somewhat bland. jqPlot will require a little TLC to get it working nicely into your layout – but it’s certainly a great tool for rendering more complicated datasets.
Chartist.js
Another personal favorite of mine is the Chartist.js library. The homepage itself is simply brilliant and very easy to navigate. This means it’s easy to skim the documentation to find answers for setup and customization.
Each chart type is fully responsive and highly customizable from sizes to color schemes. Chartist relies on SVG to render graphs as images onto the page dynamically. There are fallback options for older browsers. However, the more modern versions will support all the great features like data animation.

HighchartTable
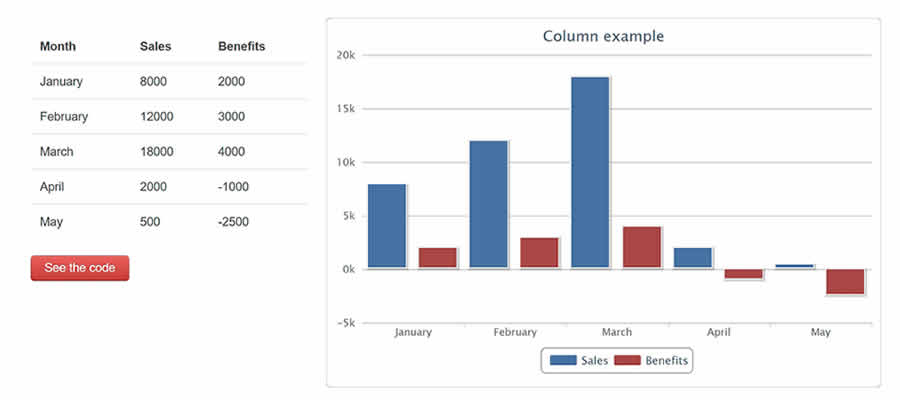
Don’t let the name fool you on this one. Although HighchartTable may seem like it’s meant for displaying HTML tables, it’s actually a plugin which converts tabular data into graphs.
This is a jQuery plugin which is also based off another library named Highcharts. In order to get HighchartTable to function you’ll first need to include the two dependencies(both of which are free). Then you can setup an HTML table and convert the design into a fully-fledged chart. Take a peek at some of the live demos to see how the plugin works.
xCharts
xCharts is meant for more advanced users that are familiar with data visualization. This plugin is based off the D3.js library for rendering in-page graphics and dynamic visuals.
Everything rendered through xCharts is adaptable and malleable. It’s easy to add your own animations or easing functions when interacting with the data. Everything is written using plain JavaScript with array values for the content. The xChart examples page has loads of samples with live easing effects.
C3.js
The open source C3.js library is based on the D3.js library. It’s meant to simplify the process of rendering data charts onto an HTML page without requiring a whole lot of custom D3 chart code.
All of the data is fully dynamic and customizable, from tooltips to graph colors. The best part is that C3.js builds on top of the D3.js library, so it’s easier for new developers to comprehend.
Pizza Pie Charts
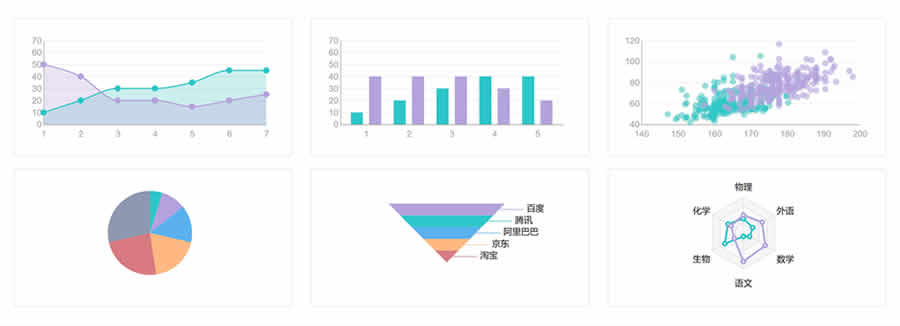
Pizza Pie Charts is a well-known JavaScript library built by ZURB for rendering SVG-based pie charts. All of the various display settings and options can be modified directly in CSS or JavaScript.
Zurb is a trusted source for great code, so you know the library is of the highest quality. The only distinction is that Pizza Pie Charts is really best for rendering data into pie charts. Other chart styles would best be found in another library.

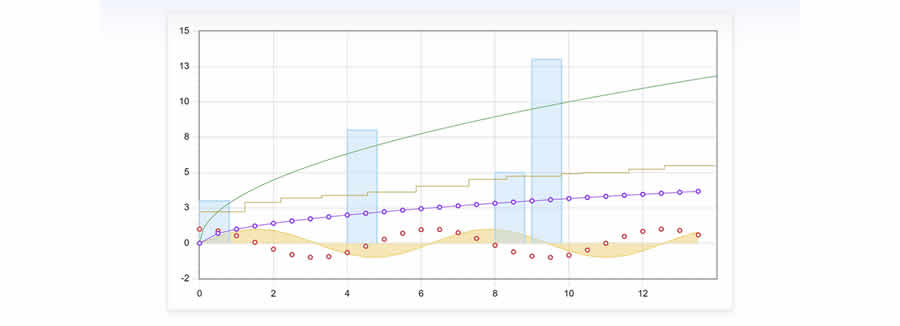
Flot
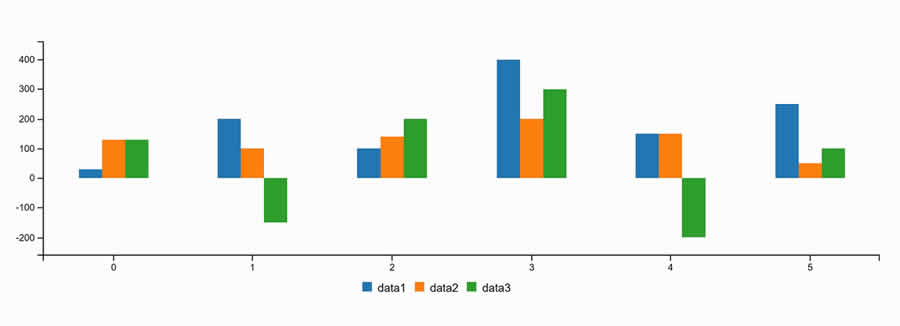
With a simple name like Flot you might expect this plugin to have some negligible features. But surprisingly Flot for jQuery is a minimal yet diverse plugin for data visualization.
The primary benefit of using Flot is the capability of creating animated plotting diagrams. This way, you can have data move through a stream representing large groups of various results. Those who want to grasp the potential of Flot may enjoy perusing the examples directory.
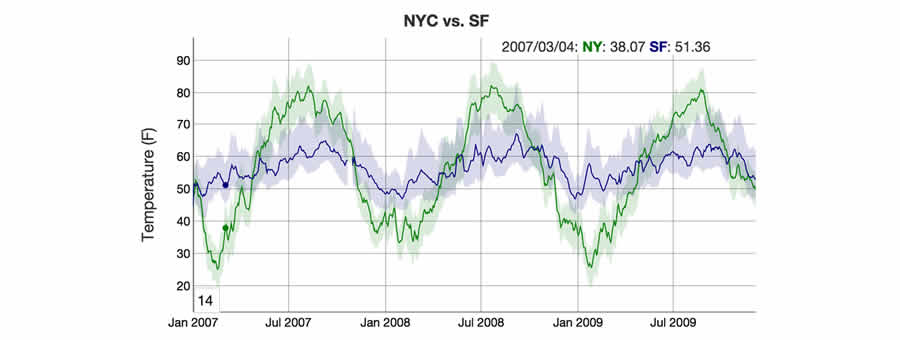
Dygraphs
Developers that are still familiarizing themselves with JavaScript can benefit from a library such as Dygraphs. The initialization code is relatively simple and it doesn’t take a lot of effort to get your first graph onto a webpage.
This library can handle enormous datasets plotting on a variety of graphs. Mobile devices also support interactivity through pinch & zoom display effects. If you wish to plot data with JavaScript, then Dygraphs is a wonderful library for getting started without any dependencies.
Protovis
No Longer Under Active Development
Advanced visualizations require a lot more in the realm of data processing. Protovis is definitely one of the more complex data chart libraries. You’ll really want to have a decent grasp of JavaScript before tackling a project with this script.
However, Protovis does have the capability of rendering exceptionally unique chart styles. The examples page is full of both conventional and customized chart demonstrations. Data organization ranges from simple pie charts to networks, tree diagrams, and even full-scale maps.
These chart libraries should be more than enough for the average web developer. Regardless of your skill level, there is always a solution for every developer, from the complete newcomer up to the wise old master.
And best of all, web standards will continue to gain support for even greater methods of data visualization and user interactivity.
Top