Effective design is crucial to a website’s business goals. In the same way that attractive people tend to get more attention, a well-designed site stands a better chance of imparting its message and funneling its users towards its desired outcomes. In a lot of cases, website owners go with what they feel is pleasing to their audiences. That, however, doesn’t necessarily mean that the audience agrees.
For web design to be considered truly effective, analytics data has to tell a story that supports the claim. The Internet is one of those rare spaces where artistic touches can be measured with hard numbers. Design elements can be tested, quantified, and improved to truly capture the collective taste of a user base.
If you ever wondered why Apple and Google are leading the way in terms of design, it’s not just because they can hire the most talented people. A big part of their success is their tenacity in testing every design variable they use. Fortunately, you don’t have to be a mega-corporation to do what both these iconic enterprises do. With simple tools, no budget, and a little effort, you can start refining your site’s look en route to better usability and conversion rates.
Measuring the Elements of Web Design
Effective design should adhere to the core principles of what makes a site good. There are four elements that need to be considered at all times when putting a site together: These are:
1. A Clear Objective
Every site needs to send a strong but implicit message to the users about what it wants to accomplish. Whether it’s a sales pitch, an opt-in offer, an invitation to consume content, or to participate in a discussion, each page has to reflect a motive that’s beneficial to both the visitor and the webmaster.
Site design should serve as a guiding force for site objectives – it should help move the audience in farther along a conversion funnel.
Metrics to Consider:
The following metrics can help you determine whether or not your site manifests a clear objective or if it’s driving away users with vague motives:
- Bounce Rate – In traditional marketing, they say that a confused mind always says no. Applying that to web design and usability, a confused visitor will always hit the “back” button on their browser. According to analytics guru Avinash Kaushik, the bounce rate is the sexiest metric in all of digital marketing. It’s simple yet it tells you so much in just one glance.
A bounce happens when a user lands on one of your pages and goes back to the referring page without clicking on anything. It suggests that the user’s intent was likely not satisfied and the user experience was largely unfulfilling. If your site has a bounce rate of 60% or higher, that may be a cause for concern. It’s an indication that your design, your messaging or both could be confusing.
The bounce rate is the percentage of visits that bounced off a site’s pages versus the total number of visits. Practically every analytics platform offers bounce rate data for an entire site and on a per-page basis. In Google Analytics, your bounce rate is one of the first things you’ll see in the dashboard.
- Conversion Rate – A conversion happens when a site goal is accomplished. This could be a visit to a page, a transaction, an opt-in to a mailing list, a phone call, etc. Your conversion rate, therefore, is the percentage of visits that went on to convert versus the total number of site visits.
Unclear objectives can make a site’s conversion rate suffer. Being clear in your messaging and having a design scheme that limits distractions can help keep your conversion rate healthy. If your site’s conversion rate is below 2%, you’ll want to review your design and see if it helps or hurts the clarity of your site’s objectives.
2. Compelling Content
Content is central to every user’s experience in a site. Whether it’s text, video, audio or images, it has to be properly laid out and formatted to attract the most engagement from your audience. When properly supported by good site design, content becomes easier to access and share. Conversely, bad design can limit content’s ability to influence users and extend your site’s reach.
Metrics to Consider:
Most analytics platforms will give you an abundance of data that will give you ideas on how well your content is performing. Page-level bounce rates, as described under the previous section, are valuable in narrowing down pages that may be suffering from design issues. Here are other metrics to look at when trying to find clues about content performance with respect to design:
- Average Time on Page – The duration of your users’ stay on your pages is an indication of their engagement level. Non-engaged traffic leaves your pages in a hurry and bad design can contribute to their eagerness to leave. If the average user spends less than two minutes on average when they visit your pages, you’ll want to investigate the matter immediately.
Average times on site/page stats are served up in Google Analytics and most other platforms. In fact, you can find this metric right on GA’s basic dashboard. For page-level time averages, you can go to GA’s “Site Content” section and generate reports for all your pages to see which ones are underperforming. From there, you might be able to spot commonalities and patterns which can help you identify design issues.
- Exit Rate – Which pages in your site are sending away the most visitors when they’re not supposed to be the final stop in a conversion funnel? This metric will let you know. Under Google Analytics’ “Site Content” report, you can sort site pages according to which ones lead users out of your site the most. Pages with abnormally high exit rates should be investigated for possible design improvements that can halt the visitor bleed.
Ease of navigation pertains to how quickly a user can browse through a site to find what he or she wants to see. The strategic use of menus, search boxes, and categories will help facilitate better navigational experiences. Ideally, a user shouldn’t take more than four clicks to go from the home page to the subpage that addresses their intent. Anything beyond that usually means your navigational design is confusing or ambiguous.
Jeff Sauro of MeasuringU wrote an excellent post on what you should look out for when trying to gauge a navigation scheme’s performance. These include:
- Findability Rate/Completion Rate
- Time to Find
- Variability in Finding Time
- Initial Click
- Success Path
- Confidence
- Difficulty:
- The Most Difficult Items to Locate
- First Path Success vs. Second Path Success
- Reasons for Difficulty
You can read the definition of each in the post linked above as well as hints on how to gather the data for them.
If you’re looking for navigation analytics reports that are easier to come by but not quite as in-depth, you’ll want to check out Google Analytics’ Navigation Summary. This hidden gem can be found under Behavior>Site Content>All Pages in GA. It shows how visitors flow from one page to another so you can gain insights on which pages are promoting good navigation and which ones are acting as traffic stoppers.
The goal is ultimately to make sure that your design is facilitating visitor movement and discovery of pages that satisfy user intent. The faster and easier the navigation paths make things for your audience, the better your big conversion numbers get.
4. Visual Appeal
Visual appeal refers to how a site holistically makes an impact to the visitor. Most people agree that visual appeal is a function of a site’s layout, color scheme, textures, fonts, and use of rich media. It’s also the part that’s the most subjective out of the four principles that make up a quality site. This means it’s the area where the most testing and analysis should be done to see which scheme pleases the majority of an audience.
For the most part, there are two types of testing done to see which visual elements work best for a site’s overall design. These are:
- A/B Split Testing – in web design and marketing, A/B testing is an experiment conducted to see which of two variants gets a better response from a small section of an audience. For instance, if you’re choosing between two calls-to-action button colors, you’ll want to perform this kind of test to see which one gets more clicked.
The same could apply to elements like fonts. If you want to know which one of two fonts promotes better reading, you can run a split test to see which setup yields better engagement signals. Average times on pages and scrolldown rates are some of the stats you’ll want to check.
Google Website Optimizer is an excellent tool for A/B testing. It’s free to use and is relatively friendly even to newbie webmasters.
- Multivariate Testing – If A/B testing tells you which one among singular elements works better, multivariate testing tells you which combination of elements promotes ideal user behavior. Does that button color go well with your background and the font style? Let user behavior give you the most honest answers.
Like A/B testing, Google Website Optimizer is a great tool for this type of test. VWO and Optimizely are also great options.
Tools to Help Improve Web Design and Performance
Planning and executing modifications to your website can be a daunting task, but this shouldn’t mean that you have to start from scratch. Listed below are tools that may help you get started.
Goal Setting and Tracking
Setting goals are an integral part in making enhancements in web design, as well as tracking them to see how you are faring. Google Analytics provides a comprehensive setup in creating goals for the changes you wish to apply. With GA, you can create custom goals, set values, record your status, and share them. You can also use Goals on Track, an alternative analytics platform for goal setting and monitoring.
Site and Page Speed
The changes you will implement in your site and webpages are likely to affect the loading speed. You can supervise these two activities using Pingdom, a tool that tells you how fast your site loads, and PageSpeed, a tool Google created that helps analyze how quickly your optimized webpages turn up.
Heat Map
Heat maps on your site allow you to determine the activities visitors do, such as clicks and scrolls, when they are on your site. It tells you which places they go to most and which areas are getting the least attention. Identifying your site’s heat map will clue you in to the aspects of your web design people consume the most. The tools that will help you monitor this are Crazy Egg and Inspectlet.
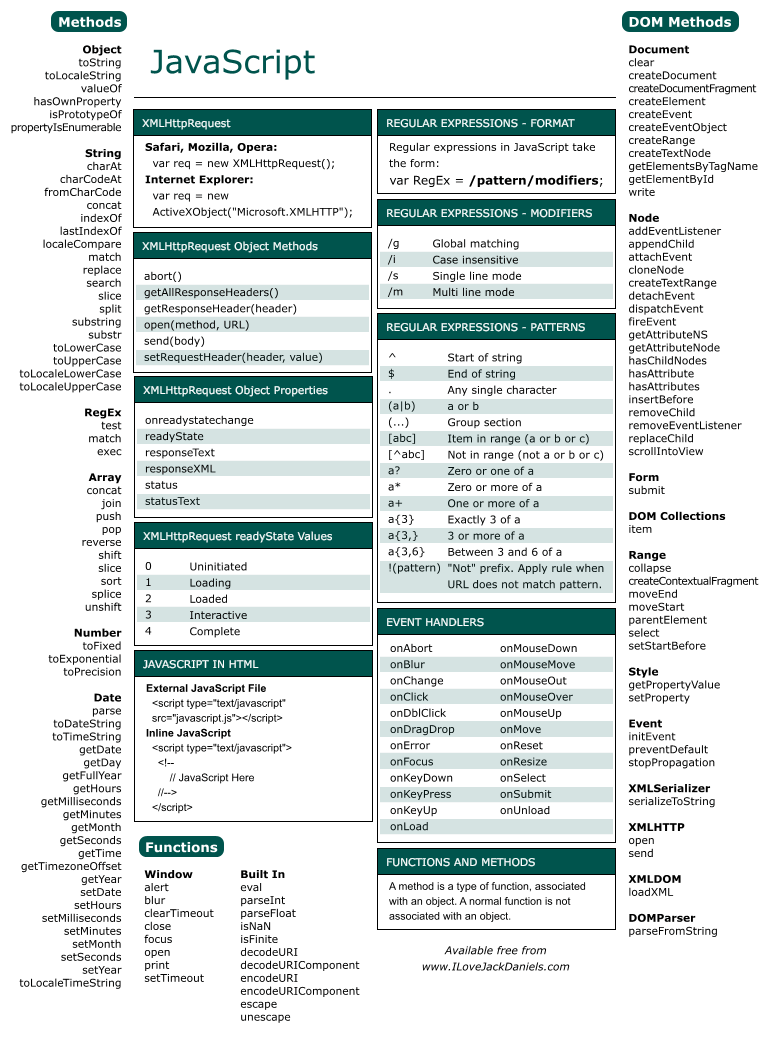
Coding Cheat Sheet
Coding is probably one of the most tedious tasks when it comes to implementing web design changes. Fortunately, ample guides are available to coders such as jQuery, CSS, HTML5, and Javascript to aid them.
Concluding
Ultimately, web design is a matter of continuous evolution. It’s good to go with artistry and best practices in the initial phases, but analytics and testing have to fuel the optimization process. Having a feel for what looks good and what works is nice; knowing for sure with numbers that don’t lie is even better.
Related Topics
Top