Over the past few years, landing page design has become an industry in its own right, complete with an abundance of tools, courses, templates, and “hacks” for getting it right.
With bottom lines hanging in the balance, savvy designers and marketers keep a watchful eye on conversion rates. But even the best landing pages typically convert less than 40% of visitors. With so much riding on conversion rates, you’d think analytics tools would do a better job helping designers improve landing page performance. Yet, out of the box, tools like Google Analytics are completely inadequate for understanding why pages are converting poorly.
Bounce rates and demographic data tell us almost nothing about what a user is actually doing when they visit your landing page. Instead, we need real, actionable insights.
Dwell time-the amount of time a user spends on your page-is the key to unlocking this information and increasing your conversion rates.
Why Dwell Time Matters
When most visitors to your landing page bounce, the obvious question is: why?
Are there issues with your website’s performance? Do your traffic sources stink? What about relevance and trust? Are you providing all the information your users need to convert?
Dwell time is a critical metric because it can indicate user intent and help you narrow down the root cause of your page’s poor performance.
If users bounce almost immediately, it’s highly likely that your traffic sources or site performance are to blame. When users scroll and read the site, only to bounce a few minutes later, it can indicate that users are interested in your offer, but aren’t comfortable moving forward without more information.
In fact, Google takes this indication of user intent so seriously that it actually uses it as a search ranking factor.
Why Current Tools Don’t Work
Given the importance of dwell time, you’d assume that most analytics tools would measure it out of the box. Unfortunately, this isn’t the case.
Most analytics packages-including Google Analytics-calculate session duration by measuring the time between pageviews.
This means that session duration stats never include the time a user spends on the final page they view. If a user hits your landing page and never views a secondary page, their session duration will read as 00:00:00, even though they may have spent minutes reading and interacting with your page.

This is a huge problem. Luckily, it’s easy to fix.
How to Measure Dwell Time
We knew that measuring dwell time was important when building the landing pages at Swish, so we wrote a simple JavaScript snippet to measure it in Google Analytics.
Add this script to your page somewhere before your Google Analytics Tracking code:
(function (global) {

    function trackDwellTime() {
        var intervalInMilliseconds = 1000;
        var timelimit = 3 * 60 * 1000;
        var label;

        var timeSpentInSeconds;
        var timeSpent;

        if (typeof arguments[0] === 'string') {
            label = arguments[0];
            timeSpent = intervalInMilliseconds;
        } else {
            timeSpent = arguments[0];
        }
        timeSpent = typeof timeSpent === 'undefined' ? intervalInMilliseconds : timeSpent;
        timeSpentInSeconds = timeSpent / 1000;
        setTimeout(function () {
            if (typeof gtag === 'function') {
                gtag('event', 'Dwell Time', {
                'event_label': label,
                'event_category': 'engagement',
                'value': 2
                });
            } else if (typeof ga === 'function') {
                ga('send', {
                    hitType: 'event',
                    eventAction: 'Dwell Time',
                    eventLabel: label,
                    eventCategory: 'engagement',
                    eventValue: timeSpentInSeconds
                });
            } else {
                console.log("No Google Analytics Code Found");
            }

            if (timeSpent < timelimit) {
                trackDwellTime(timeSpent + intervalInMilliseconds);
            }
        }, intervalInMilliseconds);
    }

    global.trackDwellTime = trackDwellTime;

})(window);
This code will fire a "Dwell Time" google analytics event every second for the first 3 minutes a user is on your page, but you can easily modify it to fire at a different interval or for a different duration.
To fire the tracking script, add the following right after your Google Analytics Tracking code on pages you want to track, replacing "label" with the name of your page or some unique identifier you'd like to see in Google Analytics:
trackDwellTime('label');
This code will work with the newer gtag.js version of Google Analytics, as well as the older analytics.js version.
Analyzing Dwell Time Results
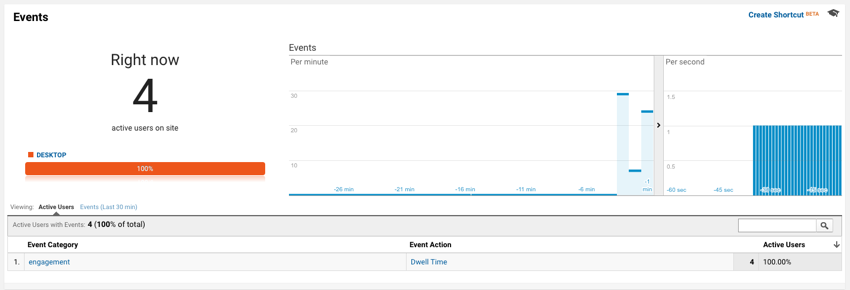
Once you've got your code installed, you can verify that it's working by navigating to your page and opening up the "Real-Time" section of Google Analytics and navigating to the Events report.
Assuming that's working, it's time to create some user segments so you can analyze user behavior based on dwell time.
I like to segment dwell time into the following buckets:
Under 2 Seconds - A high percentage of users with dwell times under 2 seconds can indicate page performance issues or poor traffic sources, since these visitors are bouncing so quickly that they're likely not really reading anything at all.
2 - 10 Seconds - Users who spend between 2 and 10 seconds on your page are likely reading above-the-fold content, but not much else. This may indicate that they believe the page isn't relevant or trustworthy and bounce as a result.
11 - 30 Seconds - Users who spend between 11 and 30 seconds but still don't convert are likely reading your landing page, scrolling, and interacting. There's good news and bad news here. The time they're spending on your page indicates clear interest. The bad news is that your page likely isn't answering important questions or addressing key concerns.
31+ Seconds - Users who spend more than 31 seconds without moving on could be slow readers, but many of them simply got distracted and left the tab open. It's helpful to segment this group out; if you find lots of users in this group, consider breaking it into multiple sub-groups.
These buckets serve as general guidelines; you can and should segment based on your own intuition and unique business situation.
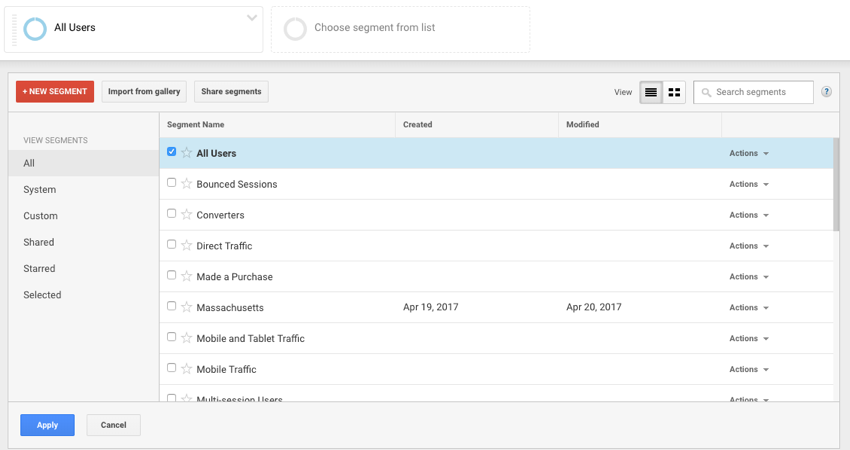
Once you've decided on your segments, you can create them in Google Analytics by using the Segment Builder. From the top of most reports, you can click Add Segment, then New Segment:
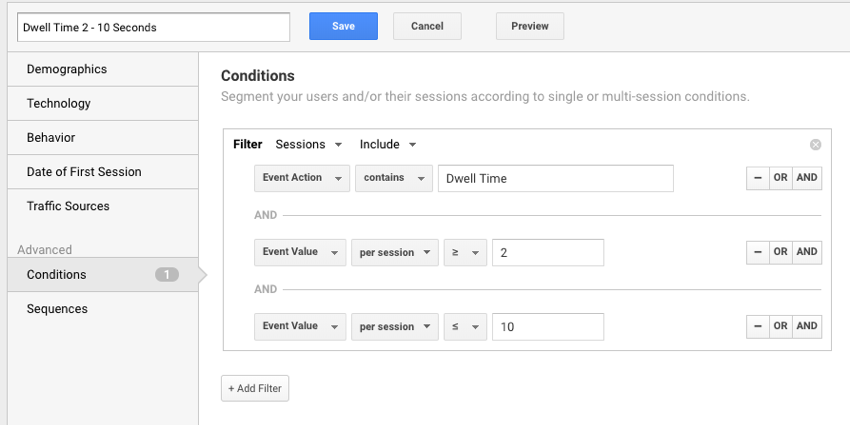
Once you're in the Segment Builder, select the Conditions segment type. You'll want to add filters for the "Dwell Time" event action, as well as the event values, in seconds, you're trying to match:
Repeat this setup for each of your segments. Once you've saved your segments, you can break down any report based on them:

Looking at the breakdown of users and which segments they fall into can help direct your thinking about what to change for the next iteration of your landing page. I've personally used this tactic to gain insights that resulted in doubling my original conversion rates.
Beyond Dwell Time
If you need even more insight into what's driving your landing page performance, usability tests, user interviews, and session replay tools like FullStory can be incredibly valuable. These approaches require a bit more investment, but when you're really stuck, they can definitely be worth the time and money.
If you're just starting to iterate, however, dwell time is a quick, cheap, and easy way to analyze your landing page bounces and pinpoint areas for improvement.
Related Topics
Top